Citation rates are up, but the sales team sees no change
You hear that your brand is appearing more often in ChatGPT or Perplexity. Your content has been cited repeatedly, and visibility looks better than competitors’. But when you ask the sales team, nobody can tell you which leads came from AI search or how much pipeline they created.
It is risky to declare citation rate a success metric at this point. Not everyone who sees your brand in a generative AI answer visits your site, and not every visitor submits an inquiry or signs a contract. To explain AEO performance, you need to separately record aggregate visibility metrics and sales outcomes for actual leads.
Blend’s own case study illustrates this gap well. After tracking more than 500 commercial-intent prompts for 90 days, its LLM visibility rate rose from 17.1% to 34.7%, an increase of 17.6 percentage points. Without disclosing the comparison basis or the starting and ending counts, Blend reported that AI-sourced MQLs increased 133% in Q4 2025. It also stated that AI-sourced pipeline in the second half of 2025 grew to about 3.5 times that of the first half, exceeding $500,000. Because it did not connect specific prompt visibility to individual leads or deals, these growth rates should not be treated as verified AEO effects.
The measurement ladder needs two separate tracks
The takeaway from the Blend case is not the large growth rate, but the structure of looking at aggregate leading indicators—prompt visibility—alongside lead-level lagging indicators after referral traffic. It tracked consistent commercial prompts, LLM referral traffic, customer self-reported discovery paths, MQLs, and pipeline together.
| Measurement scope | Values to record | Question it can answer |
|---|---|---|
| Aggregate leading indicators | Total runs by period and engine, runs where the brand appeared, cited URLs | Has brand visibility changed for purchase-oriented questions under the same conditions? |
| Web traffic | Observed AI referral sessions, landing pages, key events | Did real visits and actions occur from AI referral domains? |
| Self-reported discovery path | The AI tool named by the inquirer and the question context they remember | Were there AI touchpoints where referral information was not retained? |
| Lead-level lagging indicators | Number of MQLs, sales opportunities, pipeline value | Did identifiable leads turn into sales-ready demand? |
| Closed-won outcomes | Number of contracts and revenue, observation period by lead cohort | Did actual revenue occur after the average sales cycle passed? |
A prompt panel does not represent actual visitors. It is a synthetic observation created by running the same question-engine combinations a set number of times to observe changes in visibility. Use total runs, not the number of questions, as the denominator so a single chance appearance is not overstated as a visibility rate. If you did not repeat the runs, label the result a “one-time baseline snapshot,” not a visibility rate or trend. Blend said it tracked more than 500 prompts, but did not disclose runs by engine, repetitions per prompt, or result variance.
Referral sessions, inquiries, MQLs, and contracts, by contrast, are lagging indicators that begin with actual visits or leads. A shared identifier or validated integration between web analytics and the CRM is needed to attach specific acquisition information to a lead. Without that connection, treat GA4 results only as aggregates, and connect CRM outcomes only to leads that directly recorded an AI discovery path.
For each field, retain denominators and absolute values as well as rates. For example, write “appeared in 15 of 30 total runs” instead of “50% visibility rate,” and “increased from 2 to 4” instead of “MQLs up 100%.” These figures are hypothetical examples for explaining the recording format; they are not recommended sample sizes or evaluation criteria.
The “up to 40% improvement” reported in GEO research also needs to be read carefully for the same reason. It is a relative improvement in source visibility within generative engines, incorporating placement and citations in a benchmark of 10,000 queries; it does not mean sessions or revenue rose 40%. Effects also varied by query domain.
Large multiples are observations, not a formula for success
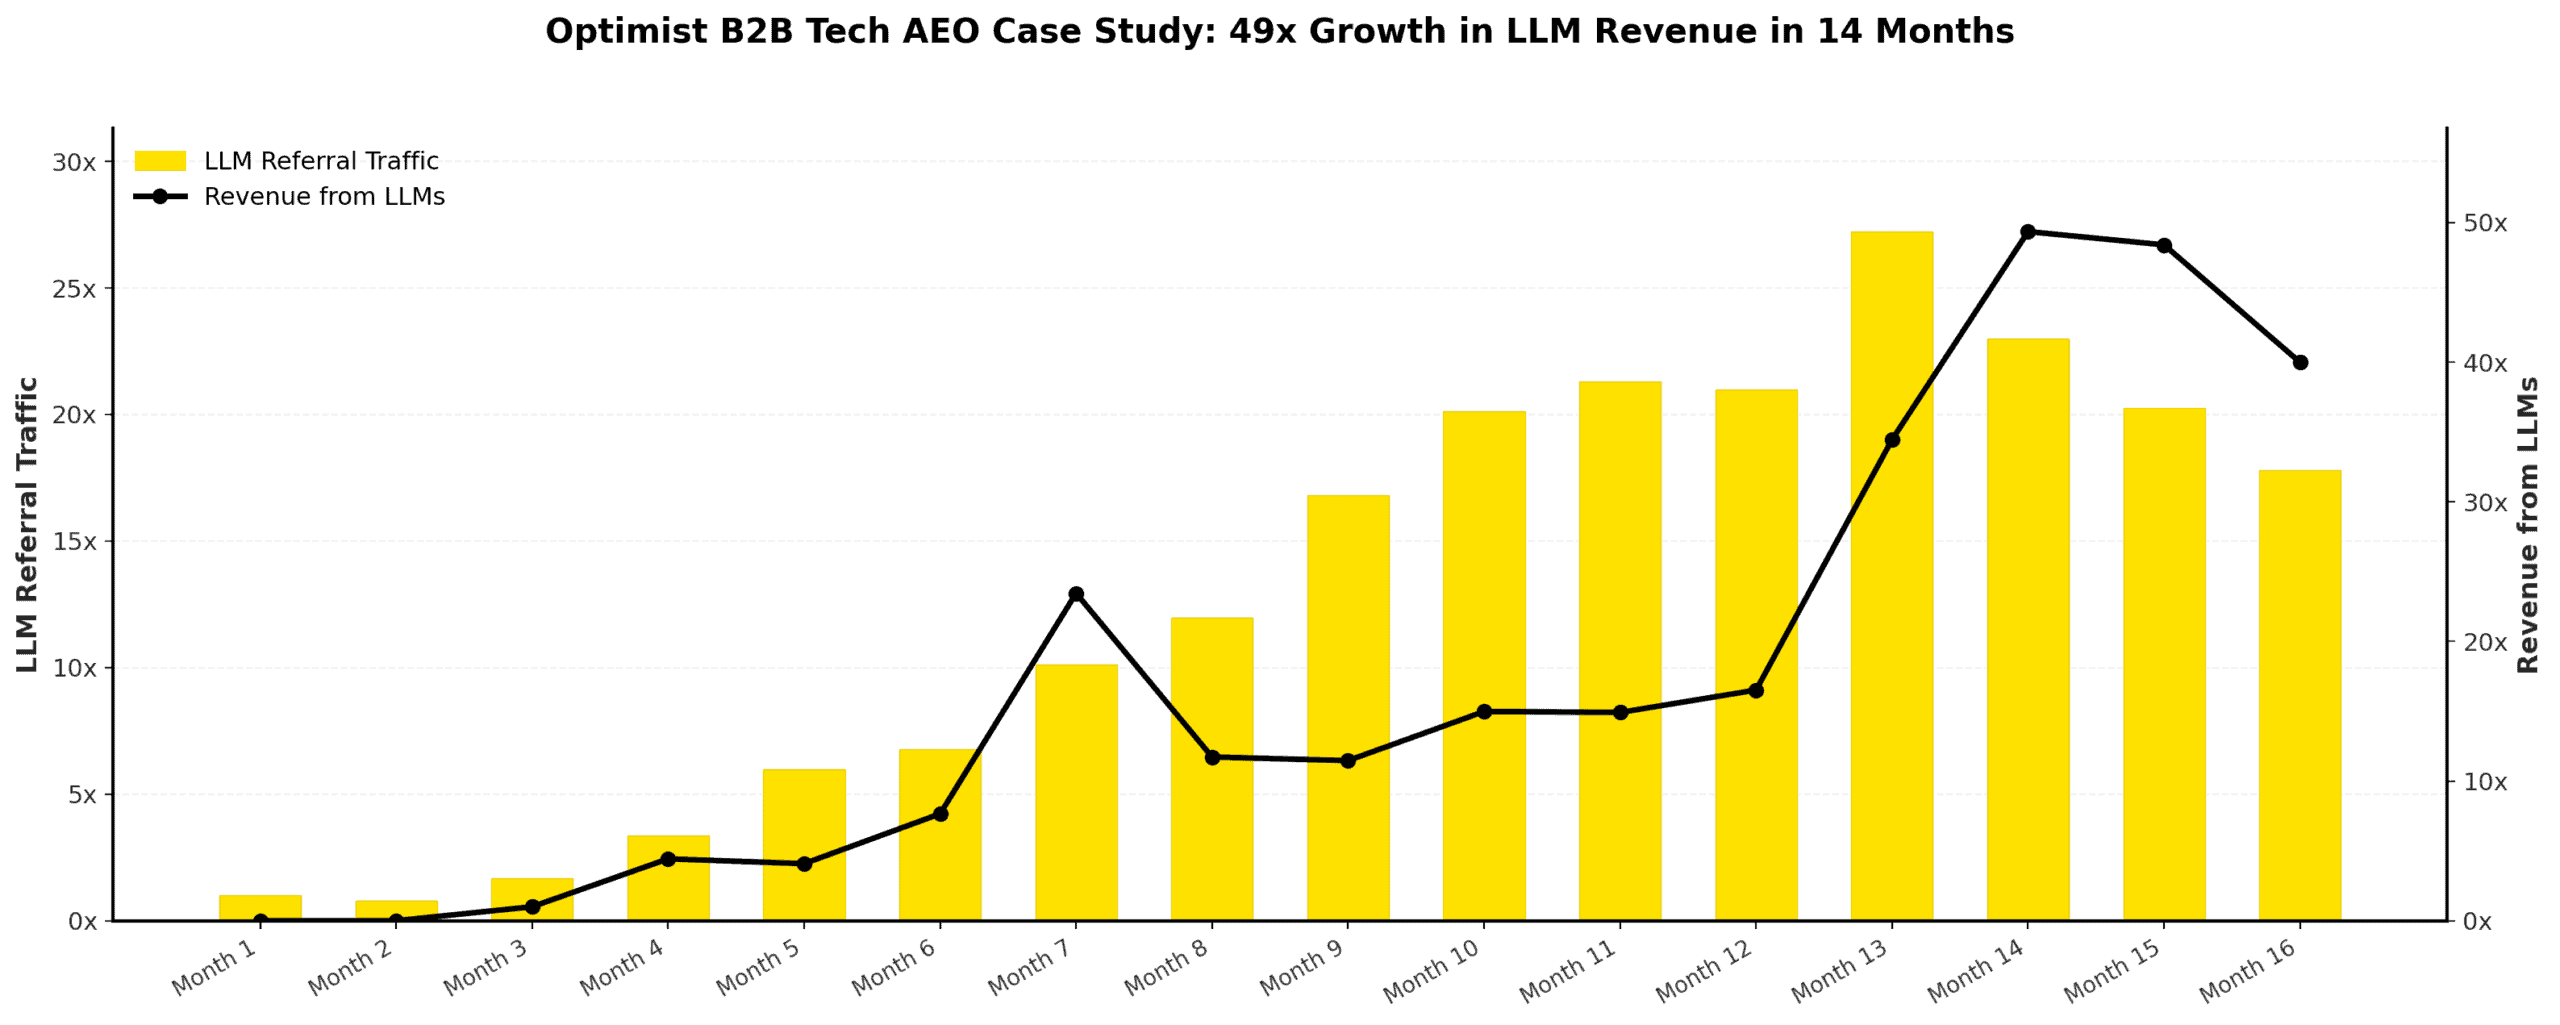
Cases published by Optimist include figures that extend down to revenue and conversions. One B2B technology company case reports that revenue from ChatGPT, Perplexity, and Claude referral traffic increased 4,900% and referral traffic increased 2,622% over 14 months. A retail technology company said revenue from those same three channels grew 13-fold year over year. A detailed fintech case states that referral conversions increased 8-fold and traffic 25-fold over eight months.
However, none of the three cases disclose the customer name, starting and ending revenue, number of deals, or a comparison group. The B2B case title’s “49x growth” and the body’s “4,900% increase” are not strictly the same calculation, and the fintech case conflicts between six months on the overview page and eight months on the detail page. Optimist also notes that multiple factors, including increased AI use and changes in user behavior, make it difficult to confidently attribute results to a particular action.
So do not turn the multiples in these cases into targets.
These figures do not prove that AEO produces growth of the same magnitude for every company. Instead, they are best read as examples showing the measurement direction: do not stop at citation rates; separately observe referral traffic, conversions, and revenue.
Today, first check whether GA4 and your CRM can be connected
You do not need to install separate software. First, sign in to GA4, open the relevant property, and prepare your CRM or lead records. The first thing to check is whether an existing integration stores acquisition information and a lead identifier together in the CRM when a form is submitted. User-ID also requires the organization to create and send its own identifier, so simply opening a GA4 report does not automatically create a connection to individual CRM leads.
- Determine lead-connection conditions first.
Check whether both web analytics and the CRM have a shared identifier or an already validated integration. If they do, create one test form submission and verify that acquisition information and the lead identifier are stored in the same CRM record. If not, set the scope for this review: use GA4 only as aggregate acquisition data, and connect CRM outcomes only for leads with a self-reported discovery path. - Set fixed questions and run conditions.
Select non-branded questions about problem definition, alternative comparisons, recommendations, and adoption conditions from sales calls, customer interviews, and search logs. Set a manageable number of repetitions for each question-engine combination, and fix the model, search mode, login status, and run date. The number of repetitions is an operational choice for creating a comparable denominator; it does not mean a statistically sufficient sample size. - Record the visibility baseline at the run level.
For every run, put the question, engine, model and mode, date, whether the brand appeared, cited URLs, and recommendation context in one row. Keep the same conditions and number of repetitions in the next measurement, then calculate visibility as “runs where the brand appeared ÷ total runs.” If each combination was run only once, retain it as a “one-time baseline snapshot” and do not call it a period trend. - Check AI referral traffic in GA4 as aggregates.
Go to Reports → Acquisition → Traffic acquisition, change the primary dimension to “Session source / medium,” and add “Landing page + query string” as a secondary dimension. Record sessions by AI-related source that appear in real data, landing pages, and predefined key events. Google describes Source as a specific platform, site, or app, and Medium as an acquisition type such as referral. - Use self-reported responses to supplement touchpoints where referral information disappeared.
Add “Where did you hear about us?” to your inquiry form or sales records, and if the respondent selects an AI tool, ask them to write the question they remember to the extent they can. People who visit after seeing an AI answer via branded search or direct entry are difficult to find through referral source alone. Connect question context to that lead record only when the inquirer provided it directly. - Extend only connectable leads through to sales outcomes.
Connect MQLs, sales opportunities, pipeline value, and closed-won revenue only for leads whose acquisition information was saved through a validated integration or whose AI discovery path was confirmed by self-report. If there is no shared identifier, do not arbitrarily match GA4 sessions to specific CRM leads. Compare lead cohorts after the average sales cycle has passed, and place prompt visibility alongside them as a separate leading indicator for the same period.
Input example — a hypothetical record, not an actual evaluation value
Measurement period: 2026-09-07~2026-09-13
Question: Compare inventory management software for mid-sized manufacturers
Engine: Perplexity
Model and search mode: values shown on the run screen
Repetitions / total runs / runs where the brand appeared: 3 / 3 / 1
Cited URL: actual URL shown in the result
GA4 source and medium: actual report values
Lead connection evidence: self-report
MQL: Yes
GA4’s current official default channel name is the singular “AI Assistant.” Referral traffic from ChatGPT, Gemini, Deepseek, Copilot, Grok, and similar services may be included here, while traffic from Google AI Overviews and AI Mode is excluded and included in Organic Search. Classification rules can change, so check actual Session source / medium as well as default channels.
Attribution reports do not show the full journey either. Google’s paid and organic last-click model excludes direct traffic and assigns 100% of a key event’s value to the last non-direct channel before conversion. Conversely, a visitor who sees an AI answer and later returns through search or direct entry may leave no LLM referral domain. Therefore, do not interpret one channel’s number as the entirety of AI’s influence.
The success criterion for the first review is that four records remain. You need run records listing engine, model, mode, and date; visibility values that separate total runs from runs where the brand appeared; actual AI-related sources, landing pages, and key events confirmed in GA4; and evidence of whether each lead can be connected. If there is no connection evidence, do not calculate revenue attribution; finish with “aggregate traffic only confirmed.”
Choose the next content when both tracks move together
If visibility rises but referral traffic and self-reported leads do not move, do not immediately conclude failure. Check in order whether the AI answer lacked a reason to click, whether the path disappeared through branded search, or whether you measured only questions far from purchase intent.
Conversely, if AI-sourced leads with connection evidence create MQLs or sales opportunities, you can expand into content for adjacent questions after allowing a sufficient observation period. Still, without a comparison group, it is more accurate to say “observable AI touchpoints contributed to this pipeline” rather than “AEO created revenue.”
If you want to dig deeper
Real-World AEO & GEO Case Studies for B2B A starting point for comparing observed AEO cases across industries and their disclosure levels. yesoptimist.com
Engineering AI Search Visibility: Our AEO Case Study Shows a structure that observes commercial prompts, self-reported attribution, MQLs, and pipeline together. blendb2b.com
GEO: Generative Engine Optimization Read the original study to review generative-engine visibility metrics and differences by query domain. arxiv.org
Traffic acquisition report Guides you through the official GA4 navigation path for checking session source and medium. support.google.com


.png)
